Uncertain weather: the oil industry under climate alarmism
By: Brian Wm. Schulte PG and Henry Lyatsky
The interpretation and opinions expressed here are the authors' ideas on related science that interests us and affects us. Some members have quite different interpretations of this science and the editorial committee actively welcomes other articles from other perspectives on this and other interesting topics
“We all know that human activities are changing the atmosphere in unexpected and in unprecedented ways.” George H.W. Bush
“To be absolutely certain about something, one must know everything or nothing about it.” Henry Kissinger


Carbon sinks are natural systems that absorb more carbon than they release. The main natural carbon sinks are vegetation, soil and oceans (Conserve Energy Future, 2018).


Figure 7 vividly shows that the oil sands in Canada produce but a tiny fraction of the U.S. coal-fired GHG emissions – and all of that is surpassed by the ever-growing emissions in China.
Prelude
The interpretation and opinions expressed here are the authors' ideas on related science that interests us and affects us. Some members have quite different interpretations of this science and the editorial committee actively welcomes other articles from other perspectives on this and other interesting topics
“We all know that human activities are changing the atmosphere in unexpected and in unprecedented ways.” George H.W. Bush
“To be absolutely certain about something, one must know everything or nothing about it.” Henry Kissinger
Many feel
passionate about climate change, and they may feel that the climate concerns discussed
in this paper are either overblown or understated. Some may feel that climate
change due to man-made greenhouse gases (GHGs) is not a valid scientific
hypothesis at all, while others may think the world is facing an existential and
imminent climate catastrophe. We find no scientific basis for either of these
extremist views.
One significant concern
is that environmental policies might cause a reduction of GDP and loss of jobs. But consider this: while the environment
improved with the disappearance of unwholesome horse manure from urban streets
when cars replaced horses a century ago, this change did eliminate some
teamster jobs, but the new transportation technology also improved productivity
and created new kinds of employment previously unimagined.
For now, though,
hydrocarbons remain vital to our way of life. To obtain the “social license” to
operate, the oil industry needs to communicate better about what it is doing in
regard to reduction of GHGs emissions; enhancing production with less
environmental impact; and vividly show what oil and gas really means to Canada in terms of economics,
creation of jobs and innovative ideas that could affect the world.
This paper will
utilize scientific research as much as possible. It represents the opinion of the authors.
Introduction
On the existing scientific evidence, and avoiding false certainties, it
seems that:
1)
The global climate is probably warming, as it
has been since the last Ice Age ended.
2)
Man-made GHGs could be a small or large
contributing factor in this climate change in the recent decades.
One complexity in climate formation is around the oceans acting as a
buffer, thus mitigating temperature changes in the atmosphere, and also acting
as a transport system, moving heat around the world (Smith et al., 2005). The mechanisms
involved in heat transfer and climate control tend to be convection cells in
the atmosphere, ocean oscillations, thermohaline circulation, sun intensity,
etc.
In the geologic past, there have been drastic changes in the climate
from meteorite-impact ejecta and volcanic dust cooling the Earth. More slowly,
the climate has changed due to variations in solar output, changes of the
Earth’s rotation and orbit around the Sun, fluctuations in the atmosphere’s gas
composition, and so on. The past succession
of ice ages apparently owes something to these and other natural factors. Fluctuations in solar intensity and effects
of these fluctuations on oceanic circulation are thought to have driven
significant climate changes throughout the Earth’s history (e.g., Smith et al.,
2005; Broecker et al., 1985; Heinrich, 1988; McManus et al., 2004).
Today, it is suspected that human emissions are also influencing the
climate. A former British prime minister, Tony Blair, among others, stated that
if we reduce GHG emissions and anthropogenic climate change turns out not to be
true, then we have reduced pollution and improved air quality. Blair also argued
that if we don’t act and man-made climate change is real, we will have betrayed
the future generations, and this is why we need to put aside discussions about
whether global warming is real and start focusing on how we can do things
better for our children and their children.
Growth of science is neither easy nor straightforward. Some commonly accepted ideas were initially
met with incomprehension or even hostility, for example:
1)
Heliocentric solar system
2)
Round Earth
3)
Germ theory of disease
4)
Genetic inheritance
5)
Evolution of life on Earth
We may chuckle at this list, but it is not easy to accept counter-intuitive
ideas that are hard to picture: the Sun, after all, “obviously” circles the
Earth. Before we get too smug, let’s ask
how many of today’s established or rising dogmas are standing on feet of clay,
and how silly they might look to future generations. Climate controls are extremely complex, and
climate models, like any models, are only as good as their assumptions,
designated parameters and variables, and factual constraints.
The first part of this article presents a general picture of the Earth’s
very complex climate, on which the external, natural-endogenous, or man-made
influences act in unpredictable ways. It
shows that while some concern about anthropogenic impacts on the climate is
scientifically warranted, alarmism is not: we simply don’t know enough about
how climate forms, and to claim that anybody can predict the climate a century
forward is absurd.
The oil industry needs to honestly tell everyday Canadians about the
climate-science uncertainties, and to show them how the industry is keeping the
country’s lights on while being environmentally sensible.
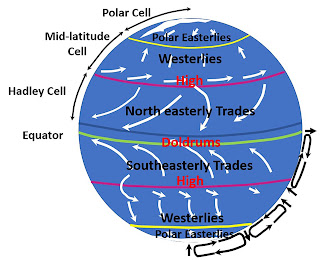
Convection cells in the atmosphere

Figure 1: Convection in atmospheric
circulation, and distribution of easterlies and westerlies. All this is part of
nautical navigation, and the charts ship captains made of ocean currents used
to be top secret. A good captain would seek a route and sailing season with
favorable winds. At the equator lie the doldrums, with less wind.
The Earth's
weather is mostly a consequence of illumination by the Sun and of the laws of
thermodynamics, producing atmospheric circulation (Wikipedia, 2018a). This circulation
is broken into cells.
1)
Hadley cell – This closed circulation loop begins at the equator, where moist
air is warmed by the Earth's sunlit surface.
The low-density warm air rises, creating a general low-pressure zone in
the equatorial regions. The air then
moves poleward in the upper atmosphere: it cools, increases in density,
descends, and creates a high-pressure zone around 30o latitude -
North and South. The Coriolis effect
causes the winds to be easterly, creating the trade winds.
2)
Polar cell – Like the Hadley cell, it is a
closed circulation loop. Around the 60th parallel the air is still sufficiently
warm and moist to undergo convection and move poleward, creating a thermal
loop. The polar cell causes the polar easterlies. The outflow of air mass from
this cell creates ultra-long harmonic waves in the atmosphere called Rossby
waves, which determine the path of the polar jet stream
3)
Ferrel cell – Part of the air rising at ~60°
latitude diverges at high altitude toward the poles and creates the polar cell.
The rest moves toward the equator where it collides at ~30° latitude with the
high-level air of the Hadley cell. There it descends and strengthens the
high-pressure ridges beneath. A large part of the energy that drives the Ferrel
cell is provided by the polar and Hadley cells that circulate on either side
and drag the Ferrel cell with it (Yochanan, 2000). This
is a zone of mixing and it explains the mid-latitude westerlies.
The Hadley and
Polar cells are products of surface temperatures, and the Ferrel cell is in
turn driven by the Hadley and Polar cells. As the surface temperature changes
when the solar output fluctuates, so will the convection cells.
El Niño-Southern Oscillation (ENSO) cycle

Figure 2: With a La Niña (on the right),
surface winds and water flow from the Americas
to Southeast Asia . As surface water is moved
away from the coast of South America, cool water from the deep ocean can well
up. In an El Niño year (left), these surface winds and the corresponding flow
of surface water weaken, allowing the water to return eastward. Warm water off
the coast of South America blocks the upwelling (Findley, 2016). Diagram from
NOAA (2014).
The trade winds are created by the high-to-low
pressure gradient in the Hadley cell. This causes surface winds and water to
flow from the Americas to Southeast Asia (Findley, 2016). As the surface water
moves away from South America, cool, nutrient-rich water from the deep ocean wells
up. This is known as La Niña. It causes colder-than-normal winters in North
America and a more robust cyclone season in Southeast Asia and eastern
Australia. With a La Niña, there is an increase in hurricanes in the Gulf of
Mexico because wind shear (difference in strength of winds at low and high
atmospheric levels) is increased over the Pacific and reduced over the Atlantic
(The Associated Press, 2010). A strong
wind shear reduces hurricanes by breaking them up.
When the gradient is reduced the trade winds
lessen; westerly winds can even be created, reducing the flow of water westward
across the Pacific. Warm water off the coast of South America blocks the
upwelling (University of Illinois, 2010; Findley, 2016).
Convective clouds and heavy rains are fueled by
increased buoyancy of the lower atmosphere due to heating by the warmer waters
below (University of Illinois, 2010). As warmer water shifts eastward, so do
the associated clouds and thunderstorms, resulting in dry conditions in
Indonesia and Australia while more flood-prone conditions arise in Peru and
Ecuador. This is a so-called El Niño. Such
events bring more tropical storms and hurricanes to the eastern Pacific,
because the hurricane-destroying wind shear increases over the Atlantic and
decreases over the Pacific (The Associated Press, 2010).
Over the last several decades, the number of El
Niño events seems to have increased relative to previous decades, and the
number of La Niña events decreased (Trenberth and Hoar,
1996). However, a much longer period of observing the ENSO is needed to
detect robust changes reliably (Wittenberg, 2009). It is possible that this apparent increase
in El Niño events is somehow linked to man-made global warming.
Other oceanic oscillations
The ocean and atmosphere interact in a coupled
system, influencing each other as the Sun heats both the atmosphere and the
ocean. Six major known oceanic
oscillations, besides ENSO, are listed below (WHOI, 2018).
1)
The
North Atlantic Oscillation (NAO) is caused by the difference of atmospheric
pressure at sea level between the Icelandic Low (between Iceland and southern
Greenland) and the Azores High (south of the Azores in the Atlantic Ocean). The
NAO drives winds from the Atlantic over Europe. The more positive the NAO, the
warmer the air that is blown toward the continent.
2)
The
Arctic Oscillation (AO), in its cool phase, causes much of North America,
northern Europe and Asia to have cold and stormy winters, and it causes an
increase in storms around the Mediterranean. In its warm phase, it brings about
the opposite, with much of North America and northern Europe experiencing mild
winters while drought conditions arise in the Mediterranean region.
3)
The
Pacific Decadal Oscillation (PDO) has its warm and cool phases, which tend to
last about 25–30 years and then switch. The PDO affects Pacific and Atlantic
hurricane activity, droughts and flooding around the Pacific basin, and winter
temperatures over most of North America (NCSU, 2018; WHOI, 2018). The PDO can
intensify or counteract the impacts of the ENSO. If both the ENSO and the PDO
are in phase, the El Niño/La Niña impacts may be magnified. Conversely, if the ENSO
and the PDO are out of phase, they may offset one another, preventing true ENSO
impacts from becoming manifest.
4)
In
the Atlantic Multi Decadal Oscillation (AMO), as with the PDO, the warm and
cool periods tend to last 25-30 years. The AMO affects air temperatures and rainfall over
much of the Northern Hemisphere, particularly in North America and
Europe (UCAR, 2018c).
It is associated with changes in the frequency of North American droughts and
of severe Atlantic hurricanes. There is a net balance when the Pacific
is warming and the Atlantic is cooling, or vice versa. The net result is to
maintain stable average surface temperatures in the Northern Hemisphere
(Fischetti, 2015).
5)
The
Antarctic Oscillation (AAO), in its warm phase, brings relatively light winds
and relatively settled weather to the middle latitudes, together with enhanced
westerly winds over the southern oceans. In its cool phase, the westerlies are
stronger over the middle latitudes, with more unsettled weather over the
southern oceans (WHOI, 2018).
6)
The
India Ocean Dipole (IOD), if positive, means that warm water piles up off the
African coast and cooler water off Western Indonesia and Australia's northwest
coast (Brokensha, 2015). A negative IOD is the opposite, with warm water off
Western Indonesia and northwest Australia, and cooler water off Africa. The
positive IOD phase is generally linked to an El Nino event.

Figure 3: Oceanic Oscillations and their distribution
around the world, and major ocean currents (from Pidwirny, 2006; Gratz, 2016).
PDO = Pacific Decadal Oscillation; ENSO = El Niño-Southern Oscillation; AMO =
Atlantic Multi Decadal oscillation; NAO = North Atlantic Oscillation; IOD =
India Ocean Dipole.
These oceanic oscillations rearrange patterns
of atmospheric pressure, affecting the wind patterns and sea-surface
temperatures. They also affect precipitation, and they can drastically change
regional weather (WHOI, 2018).
Thermohaline circulation

Figure 4: Major ocean currents of the world.
The Gulf Stream flows from the Gulf of Mexico to Europe, carrying warm water
(from Pidwirny, 2006).
Thermohaline
circulation is largely driven by the formation of deep-water masses in the
North Atlantic and in the Southern Ocean due to differences in the water
temperature and salinity (Wikipedia, 2018c). The
North Atlantic Drift is an example of thermohaline circulation.
Thermohaline circulation drives the so-called
“ocean conveyor belt”, which shuttles sea water of different density around the
world’s oceans (Schultz, 2009) and links major surface and deep-water
oceanic currents in the Atlantic, Indian, Pacific and Southern oceans (UCAR,
2018a). Thermohaline
circulation is affected by global water-density gradients due to surface
heating and freshwater fluxes (Rahmstorf, 2003; Lappo, 1984; Wikipedia,
2018b) such as river discharges and melting of glaciers.
These present-day
patterns are just a snapshot in geologic time.
As the world climate gets significantly cooler or warmer, they
change. Thus, global-scale climate
change – from whatever causes – can mean big and unpredictable changes of
regional climates.
Major climate periods in recorded history
Who now remembers the Middle East’s Fertile
Crescent? It is largely desert today –
and yet, when it really was fertile several millennia ago, that’s where much of
the human civilization got its start!
The ‘Roman Warm
Period’ lasted from 250 BC to 540 AD. It is thought to have resulted from a
lull in volcanic eruptions and/or by fluctuations in ocean-warming events such
as the El Niño.
The Roman Warm Period saw the flourishing of
the Roman Empire. The glaciers in the Alps shrank and, quite possibly, receded
to their modern extent. Around 201 BC in the Second Punic War between Carthage
and Rome, Hannibal’s Carthaginian army crossed the Alps with its elephants.
Around 540 AD, according to evidence in tree
rings, there was a sudden and catastrophic drop in temperatures,
which is thought to have been caused by a comet exploding in the atmosphere (Highfield et al., 2000). This explosion blanketed the world with a cloud of dust which blocked
the sunlight. Result:
the ‘Dark Ages Cold Period’.
The Earth heated up again in the ‘Medieval Warm
Period’ of 950–1250. It is thought that
this was only a regional event, caused by some changes in heat distribution
around the world (Schultz, 2009). The
warming was mostly felt in the Northern Hemisphere, while the Southern
Hemisphere was cooler.
It has been hypothesized that increased solar
output in a grand solar maximum (1100–1250) and a lull in volcanic eruptions
(Schultz, 2009) not only started but maintained a strongly positive NAO mode,
which caused persistent warm winds in the Northern Hemisphere, and a La Niña
mode that cooled the Southern Hemisphere. These NAO and La Niña modes were
connected by thermohaline circulation and they reinforced each other in a
positive feedback loop.
Then came four massive tropical volcanic
eruptions beginning around 1250, and they brought on the Little Ice Age
(1250–1850). The volcanic activity
throughout the Little Ice Age included eleven major eruptions, three of those
at 7.0 on the VEI (Volcano Explosivity Index). In the last 10,000 years there
were only ten known eruptions with a VEI of 7.0, and three of them occurred
during the Little Ice Age.
These three volcanic eruptions were:
1)
Mount
Samalas on Lombok Island, Indonesia in 1257, which formed a crater lake (Segara
Anak).
2)
An
eruption around 1465, location uncertain. On October 10, 1465 in Naples, Italy
the sun turned blue at noon (this is surprising: particulates in the atmosphere
usually turn the sun red; Gorvett, 2017; Krazytrs, 2017). Evidence of this
extremely massive eruption can be seen in ice cores from both poles. It might
have occurred somewhere in the tropics, as suggested by the distribution of the
ash.
3)
The
Mount Tambora (1815) eruption, which was probably the most devastating in
recorded history.
The Little Ice Age also saw four episodes when
sunspots became exceedingly rare and the solar output correspondingly decreased,
which contributed to cooling the climate: the Wolf Minimum (1280-1350); the
Spörer Minimum (1450-1540); the Maunder Minimum (1645-1715); and the Dalton
Minimum (1790-1820). These minimums might have modified the Arctic
Oscillation/North Atlantic Oscillation (Shindell et al., 2001).
Where we are now
After 1850 the Earth began to warm up again,
which slightly preceded the spread of the Industrial Revolution. Since then,
the average global temperature has continued, though far from steadily, to
rise. Some of the recent warming might have been due to several man-made
factors.
1)
Burning
of fossil fuels such as oil, gas and coal for electricity and heating, which
accounted for 42% of the GHG emissions in 2016 (IEA, 2016).
2)
Transportation
by planes, rail, automobiles etc., which accounted for 24% of the 2016 GHG
emissions (IEA, 2016).
3)
Deforestation,
especially of the rain forests which provide a cooling band around the equator,
accounts for another ~15% of GHGs. This
happens because felled trees release the carbon they are storing into the
atmosphere (Scheer and Moss, 2012).
4)
Methane
release by the oil and gas industry.
However, from 1990 to 2012, the amount of industry-emitted methane
dropped by 11% thanks to improved practices (Ward, 2015).
5)
Livestock
farming, where cattle and sheep produce methane as flatulence from digesting
grass. In Britain it is responsible for 25% of the methane produced (Allen,
2008). Enteric fermentation is the second largest cause of methane release. The
future will probably see an increase in livestock farming to feed a growing and
more affluent population.
6)
Fertilizers
containing nitrogen produce nitrous oxide. The key to using nitrogen in
fertilizers more efficiently is to have good growing conditions, so the crops
can take up and make use of more of the nitrogen, and to apply the nitrogen in
small doses at key times in the plants’ growth.
7) Fluorinated gases that are used in
commercial and industrial refrigeration, air-conditioning systems and heat-pump
equipment, as well as blowing agents for foams, fire extinguishers, aerosol
propellants and solvents.
Carbon sinks
Carbon sinks are natural systems that absorb more carbon than they release. The main natural carbon sinks are vegetation, soil and oceans (Conserve Energy Future, 2018).
One of the biggest sinks is the rain forest. At
one time, it was able to absorb from the atmosphere two billion tonnes of
carbon dioxide each year. Now, according to studies, it is only able to
withdraw one billion tonnes per year (Radford, 2015).
Research is
ongoing on carbon sequestration in soils, and on how
this can be applied in land-restoration programs in places like the North
American prairie, the North China Plain, and even the parched interior of
Australia. Adding carbon back into the soil will boost soil productivity and
increase its resilience to droughts and floods (Schwartz, 2014).
Our
specific knowledge of the oceans is extremely sketchy due to a lack of broad-scale
measurements: the oceans are vast and deep, and deployment of instruments to
provide good data coverage on a sustained basis can be prohibitively
expensive. There seem to be two
mechanisms of how the ocean handles carbon (Conserve Energy
Future, 2018).
1)
The biological pump transfers
surface carbon towards the seabed through the food web, where it is covered by
sediments and stored in the long term.
2)
The physical pump exists due to
the ocean circulation. In the Polar regions, denser water flows towards the
deep sea, dragging down the dissolved carbon. At high latitudes, the water will
store CO2 more easily because low temperatures facilitate atmospheric
CO2 dissolution. It has been estimated that the ocean stores 50
times more carbon than the atmosphere.
Some
of the CO2 combines with calcium already present in seawater, forming
calcium carbonate which is used by shellfish and reefs (Conserve
Energy Future, 2018). When these organisms die, the
organic material sinks to the ocean floor, where it is buried by sediment and
is thus taken out of the environment for millions of years.
Some controls on the climate
As we have seen, the
Earth’s climate is complex, and climate changes over a short period can be
controlled by many factors.
1)
Oceanic
oscillations and thermohaline circulation and their interactions with each
other.
2)
Solar
activity. We do not yet understand how exactly it affects the climate in the
short term, but it may alter the oceanic oscillations. Long-term, because the Earth sits in the
“Goldilocks zone” in the solar system, where the sun is neither too hot nor too
cold to sustain life, significant changes in the solar output could be
devastating. Anyone who has experienced
the air chill in a solar eclipse will know that unease.
3)
Large
meteorite impacts, which cause very rapid changes in the climate due to both explosive
dust ejection into the atmosphere and a spike in volcanic activity brought on
by the impact.
4)
Large-scale
volcanism, which can cool the Earth by putting dust into the air.
5)
Changes
in the atmosphere’s composition. Today, the gases in the air are not all
natural, but some of them are emitted by humans. What effect human emissions have on the
climate is speculative.
Other factors can affect our global climate
over longer stretches of geologic time.
1)
Tectonics causes
changes in ocean currents, for example when a new mid-ocean ridge rises,
disrupts the previous currents, and causes a eustatic rise in sea level. A eustatic sea-level drop and other kinds of
ocean-current disruption can occur if a mid-ocean ridge disappears.
2)
Tectonics is thought to have created
large super-continental masses (e.g. Pangea, Gondwana), which promoted
continental climates. If large continents break up into smaller pieces, or
parts of them subside into the sea, the areas of continental climate are
reduced and oceanic climates become more common.
3)
Increases in water vaporization
can be caused by global warming or by expanded surface area of the seas, which
will increase humidity. Water vapor is a greenhouse gas, although an extensive
cloud cover can also blot out the sunlight. Global cooling, or a big eustatic
sea-level drop (and thus sea-area shrinkage), can have the opposite effect.
4)
The position of continents in
relation to the poles will also affect their regional climates. If the land mass is near the pole, less
energy from sunlight results in lower temperatures and less vegetation, whereas
near the equator the result is a warmer regional climate.
5)
Melting of polar ice freshens
the ocean water, which has the potential to alter the thermohaline
circulation around the world (UCAR, 2018b).
6)
Earth's precession (change in the tilt of the
rotational axis of the Earth relative to the Earth’s orbital plane) is
periodic. This influences the climate on a 23,000-year cycle.
7)
Milankovitch
Cycles are changes in the eccentricity of the Earth’s orbit around the Sun due
to gravitational influences of other planets. The main cycles seem to have
periods of 20,000, 40,000 and 100,000 years, which promotes an ice age every
100,000 years or so (Blosser, 2015).
The past changes in climate were entirely
natural, but now we cannot rule out human impacts as the planet's average
surface temperature has apparently risen since the 19th century. By
modern estimations, most of the recent warming seems to have occurred until the
late 1990s, when the temperature rises apparently stalled (NOAA, 2018; Rose,
2012).
Some uncertainties about global warming
The world’s climate is cooling and a new ice
age is imminent: many college students were taught this in their science
classes in the 1970s. The supposed cause
of this cooling was a natural climate cyclicity, made worse by the release into
the air of sunlight-blotting, man-made aerosols. Trying to airbrush it from history, modern
climate alarmists often deny the global-cooling scare of that age, if they
bother to mention it at all – but that scare was widespread and strong, in both
scientific communications and in the ever-alarmist media.
One of the current questions about global
warming is how surface temperatures seem to have remained constant for the past
two decades or so: it’s the so-called global-warming “pause” (Fischetti, 2015).
This pause (assuming it is indeed just a temporary pause and not a new
long-term trend) could be caused by the PDO and the AMO currently being off
balance towards the cooler side. These warmer and cooler periods of the Pacific
and Atlantic Ocean can last for decades.
However, our extremely sketchy factual
knowledge of the oceans raises doubts about the “official” claims that excess
heat from ongoing global warming is somehow hiding in the oceans and will soon
come out with a vengeance. The very term
“pause” is very tendentious, even perverse, putting theory before facts, as if
the observed stable temperatures are aberrant and the theoretical warming trend
is somehow intact.
A speculative story runs like this. When the Pacific is warming, the Atlantic is
cooling, and vice versa. These phenomena offset each other and maintain a
stable surface temperature in the Northern Hemisphere (Fischetti, 2015). For the past decade, northern Pacific cooling
has been greater than northern Atlantic warming. This slows down the rate of
global warming. In other words, if the two oceans were in a perfect offset
cycle with one being cool and the other warm, we’d have felt higher surface
temperatures today.
There is also another complication: the
Antarctic and Arctic ice sheets do not shrink or grow in tandem. Speculatively,
this could be because the Southern Ocean Circumpolar Current prevents warmer
ocean water from reaching the Antarctic sea ice zone, which helps to isolate
the continent. The winds in the ice zone keep the water extremely cold, which
enables the ice cover to grow even as global temperatures increase (Berwyn,
2016).
One argument proponents of man-made global
warming use is a supposed increase in the frequency and intensity of hurricanes. But any such dynamics can be perfectly
natural. There were 29 hurricanes
tracked into the Caribbean in the ten strongest La Niña years, when at the same
time there was a positive Atlantic multidecadal oscillation period (Klotzbach,
2011). There were only two hurricanes tracked through the Caribbean in the 10
strongest El Niño years, when at the same time there was a negative Atlantic
multidecadal oscillation period. This illustrates the climate’s complexity and
militates against simplistic default judgments.
The unknowns are vast
and many. The Arctic ice seems to have
stabilized or even re-grown in the recent years, after a previous period of
substantial reduction. Only time will
reveal the actual long-term trend.
Besides, it is important to specify the nature of ice measurements being
quoted: is it the area covered or the total volume of the ice? Over what length of time? Are the entire averages being considered, or
just a minimum vs. a maximum? Is the
estimated change large or too trivial to matter?
Another confusing
issue is that academic and government science agencies are under attack in many
circles for allegedly misrepresenting the past global temperatures and ice
extent, in order to make any recent changes look bigger. Alarmism makes it easier to attract public
funding on which the academia depends.
Because the academia is a tightly closed shop organized around mutual
“peer review” of researchers’ work, transparency is lacking and conformism is
easy to enforce (see Climategate). Keeping an open mind, it is therefore wise
to take modern climate projections and models with a big grain of salt, and to expect
that accumulating new facts will clarify the picture over time.
As well, the recent
decades saw strong volcanic activity. The 1991 Mount Pinatubo eruption in the
Philippines, for example, sent tens of millions of tons of sulfur dioxide into
the stratosphere, promoting cooler weather and masking the effects of any
possible warming (Upton, 2016).
The greenhouse
effect, where GHGs trap the solar heat on Earth and prevent its re-radiation
into space, has been well understood at the laboratory level for many decades. It is undeniable also that human activity
today releases a variety of GHGs into the air, where many of these GHGs, being
slow to break down, accumulate. What is
less clear is whether or how laboratory-level understanding scales up to a
global level. What positive and negative
feedbacks kick in? What other climate
drivers does the supposedly increased greenhouse effect compete with, and which
drivers have the most impact? That the
GHGs are a climate-driving factor is probable.
How much of a factor, remains very unclear.
Another concern is
that climate science relies very heavily on abstract numerical models, even
while the factual measurements and data collection – especially in the oceans –
are lagging. Absurdly, the “official” UN
climate models, assumption-based as they are, claim to predict the world’s
temperatures almost a century from now!
Such pseudo-predictions are arbitrary and tendentious, almost
fraudulent, and they should be dismissed.
To use them as a basis for public policy – as the 2015 Paris agreement
insists on doing – is obscenely irresponsible or worse.
The main enemies of
responsible climate science appear to be two opposing extremist twins: (1) official
alarmism and (2) total denial. Both
these absolutisms are false – and very dangerous.
Spectacularly failed
alarmist predictions are too many to list.
The Arctic ice is supposed to be all gone by now. Almost comically, the late 1990s saw the
infamous hockey-stick graph, which claimed that the world was entering a
runaway and accelerating climate warming.
It was proposed just when the so-called “pause” in warming occurred.
Any kind of weather
is ascribed by the alarmists to man-made global warming. Record cold snaps and heat waves are equally
pronounced to be evidence of global warming.
Alternatively, some inconvenient cold episodes are simply left without
comment. Rain or shine, freeze or thaw,
snow or melt, flood or drought – all are declared to be produced by
catastrophic global warming. This is
simply not credible.
The other extreme is
total denial that human drivers on climate change even exist. Given the propaganda power of official
alarmism, dissent is very welcome.
Still, the greenhouse effect is fairly well understood at least in
principle, and the GHGs in the air are measurably accumulating.
Global warming is probably occurring it is just
the amount of it is unclear due to dynamic processes occurring in nature. Some fraction of it – could be a little or a
lot – is perhaps attributable to human influences. To be more specific would be too speculative.
Canada’s CO2 emissions

Figure 5: Share of electricity sources in the
United States (EIA, 2018) and Canada (NRC, 2018a). Perhaps due to our
geography, Canada is predominately hydroelectric (renewable) while the U.S. is
largely on natural gas and coal.
In Canada, five provinces and one territory
produce over 90% of their electricity from renewable sources: Newfoundland
& Labrador, Quebec, PEI (wind), Manitoba, BC and Yukon (NRC, 2018a). From
2000 to 2016, Canada has reduced its CO2 emission from electricity
generation by 39% (NRC, 2018b). Electricity generation accounts for only 11% of
Canadian GHG emissions due to high use of hydro, nuclear and other “clean”
energy sources (NRC, 2018a).
While coal is still a significant source for
power generation, the growing abundance of low-cost natural gas from fracking
is displacing it, as coal-fired power plants switch to cleaner and cheaper
gas.

Figure 6: Electricity sources for BC (left)
and Alberta (right). Data from NRC
(2018a). BC is overwhelmingly hydroelectric while Alberta uses a lot of coal
and gas. Alberta burns more coal than all the other Canadian provinces combined
for electricity generation.
The other big sources of CO2
emission in Canada are the oil and gas sector (26%) and transportation (25%)
(MRC, 2018a). The oil and gas industry’s emissions break down thus (CAPP,
2018):
10% Oil
sands
11% Other
oil and gas upstream activities
5% Downstream and
transportation

Figure 7: Comparison of the oil-sands GHG emissions and the coal-generated
emissions in the United States (2013 coal GHG power-generation data from the
U.S. Energy Information Administration and 2013 oil-sands GHG data from
Environment Canada, National Inventory Report 1990-2013: Greenhouse Gas Sources
and Sinks in Canada).
Figure 7 vividly shows that the oil sands in Canada produce but a tiny fraction of the U.S. coal-fired GHG emissions – and all of that is surpassed by the ever-growing emissions in China.
Standard of living and greenhouse gases
That fossil fuels
make our way of life possible is self-evident.
This does not mean, however, that no reasonable environmental policies
can ever be implemented. It only means
we have to be smart, mind the costs, and be sensitive to the moods and needs of
the mainstream Canadians.
Large countries with
high GDP are the U.S., China, Japan, Germany, United Kingdom, France, Brazil,
Italy and Canada. There is a strong coupling between economic growth and GHG
emissions. Many people are concerned that by reducing their emissions they will
have to reduce their standard of living.
Quebec, Prince Edward
Island and Ontario have experienced varying degrees of success in reducing
emissions (Hughes and Herian, 2017). Ontario, in particular, has rapidly
decreased its CO2 emissions from 2005 to 2009 by phasing out the
generation of electricity from coal in favor of natural gas and renewables. However, this policy came at a tremendous
cost to the ratepayers and it partly caused the crushing electoral defeat of
that province’s previous government.
Therein lies both a
conundrum and a way forward. We must
always make sure that mainstream Canadians have a vivid and immediate idea of
what any particular public policy, be it industrial or environmental, means for
them.
Improving the oil and gas industry’s PR
At the 2014 Unconventional Resource Technology Conference (URTEC) in Denver, Anadarko Petroleum’s VP Rockies Scott Key spoke about minimizing community and environmental disruption in their shale plays. He spoke about zero methane emissions, centralized stimulation centers to reduce noise levels, and transporting water and produced liquids underground by pipe to reduce truck traffic. These actions increased Anadarko’s local social license to operate.
This example shows that the social license must come not from implacable special-interest groups but from everyday citizens. It is to regular Canadians that our PR should be addressed. “What does it mean for me?” is the question on the mind of a voter assessing a proposed public policy or political platform (Lyatsky, 2017).
We must also be very clear about the vast uncertainties of climate
forecasts. Let us be honest about the
real climate concerns, and be humble about how little we still know.
Mainstream Canadians want the vital benefits coming from production and
use of fossil fuels: affordable transportation and heating, vital oil-derived
materials, good jobs, safe and strong communities, and good public services
paid for by reasonable taxes and royalties.
Still, mainstream Canadians want regulations to keep our environment
reasonably clean.
To attract foreign investment, it would be nice if the oil and gas
industry and the provincial and federal governments could work in cooperation through
the various professional organizations like CAPP, APEGA, etc. and policies be
more self-regulatory with oil and gas companies understanding the negative PR
and effect on the entire industry if they were to fail in reducing their GHGs
emissions or impact the environment in a negative way.
Oil and gas companies also have a vested interest in developing research
and technologies to help with changing how we do things to improve our
production, reduce costs and lessen our environmental impact. Better tax
incentives and awards in reduction of GHGs emissions would be a nice carrot to
the industry rather than introducing carbon taxes which tends to be more of a
stick.
Alberta in 2016 placed 43rd overall out of 96
locations for upstream oil and gas investment, down from 25th in 2015 and 15th
in 2014 (McGarvey,
2016). This change is due to policies that were introduced that were confusing and possibly
costly, high
taxation, and uncertain environmental regulations (McGarvey, 2016).
For far too long, we oil people have been talking not to the general
public but only to ourselves about the issues. We must convince mainstream Canadians
that oil and gas production and use are vital for them.
The oil industry must explain and demonstrate to the public how its work is making our very way of life possible. At the same time, we must show that we are making changes to reduce our environmental impacts where possible. We can showcase technologies like fiber optic cables being used to monitor pipelines for leaks and pressure drops (as opposed to the past practice of long “gauge runs” where a worker drove hundreds of miles on back-country roads to manually record analog-gauge readings). To have intelligent conversations with those that oppose oil and gas we need to use facts to show what we are doing to decrease our footprint on the environment while keeping everybody’s lights on.
The
Canadian oil industry has been able to reduce its carbon footprint through
strong environmental regulations, such as those around venting and flaring of
natural gas. If the entire world adopted our regulations, it might be able to
cut the GHG emissions from the oil and gas industry globally by 23% (Weber,
2018). Our oil industry is continually working on ways to reduce GHG emissions
through technological and operational improvements. Evidence of this is that in the oil sands GHG
emissions per barrel have dropped 29% from 2000 to 2016 (NRC, 2018b).
Canada
imports oil from other countries in part because most of our refineries cannot
handle the Canadian heavy crude. It was
decided years ago that it was cheaper to import sweeter blends of foreign oil
rather than build the infrastructure to transport heavy oil eastward. Another
reason Canada imports foreign oil is that the oil industry has failed in its PR
game (Lyatsky, 2017). Our own long-standing
failure to address mainstream Canadians has enabled special interest groups to
sow disinformation and confusion. That,
in turn, has opened the political space for ideologically and irrationally
anti-oil governments to block the development and transportation of Canada’s
own oil and gas.
The
oil industry’s failed PR strategies must be reversed. We must point out that much of the imported
oil comes from dubious foreign regimes with bad human-rights and environmental
practices, and that it often puts petrodollars into hostile or dangerous hands.
We
should ask everyday Canadians to starkly imagine their lives if the fossil
fuels and plastics were suddenly to disappear.
We
in the oil industry need to show that we are acting reasonably, based on
reasonable assessment of climate science.
For the next several decades, there is no alternative to fossil fuels,
especially natural gas. But technology
is changing, and new energy sources will inevitably increase their share in our
ever-growing energy mix. The industry
must show that it is meeting the current and future energy demand responsibly,
while also keeping an eye on useful innovations. Companies like BP, Repsol and
Shell are already investing in battery charging and swapping for
electric-powered locomotion.
The
oil-rich Canadian provinces contribute into the national transfer-payments
system that distributes wealth around the country. Provinces like Quebec and
PEI receive large transfer payments.
Everybody uses oil, gas and petrochemicals. Canadians outside the prairie provinces need
to hear this truth loud and clear: the oil industry is Canada’s industry. And that means it’s every Canadian’s
industry.
And
so, we must learn to think like most Canadians think. We must learn to see ourselves through their
eyes. They, and not government
bureaucrats or environmental campaigners, are the ones we need to address. They are the only ones who will give us the
social license to operate.
To
do this we need to discuss climate-science uncertainties without sounding like
wild-eyed total deniers. Failure to
develop smart PR is what has allowed hostile governments and special interest
groups to hamstring our industry in recent years. We must learn to speak with mainstream
Canadians on their own terms. Only then
can we succeed.
References
Allen, P., 2008, Sheep flatulence
inoculation developed. The Telegraph, https://www.telegraph.co.uk/news/newstopics/howaboutthat/2076607/Sheep-flatulence-inoculation-developed.html.
The Associated Press., 2010, La Nina
Stirs Hurricane Worries in Gulf. he Associated Press. All Rights Reserved. https://www.cbsnews.com/news/la-nina-stirs-hurricane-worries-in-gulf/.
Berwyn, B., 2016, Why Is
Antarctica's Sea Ice Growing While the Arctic Melts? Scientists Have an
Answer. InsideClimate News, https://insideclimatenews.org/news/31052016/why-antarctica-sea-ice-level-growing-while-arctic-glaciers-melts-climate-change-global-warming.
Blosser, J., 2015, Scientists:
Orbital Variations Main Cause of Climate Change. Newsmax, https://www.newsmax.com/newsfront/scientists-milankovitch-cycles-orbit-variations/2015/03/11/id/629605/.
Broecker, W., Peteet, D., and Rind,
D., 1985. Does the ocean atmosphere system have more than one stable mode of
operation? Nature, 315, 21–26.
Brokensha, C., 2015, Why the winds
were bad in the Mentawais this season. Swellnet Analysis,
https://www.swellnet.com/news/swellnet-analysis/2015/10/14/why-winds-were-bad-mentawais-season.
Canadian
Association of Petroleum Producers (CAPP), 2018, website. https://www.capp.ca/responsible-development/air-and-climate/climate-change.
Conserve
Energy Future, 2018, What are Carbon Sinks?
https://www.conserve-energy-future.com/carbon-sinks.php.
Findley, H., 2016, Record Breaking
El Niño: 90% complete, Climatology, Disasters, Events, Health, Meteorology, https://whethertheweatherbefine.wordpress.com/2016/01/02/record-breaking-el-nino-90-complete/.
Fischetti, M. 2015, The `Pause' in
Global Warming Is Finally Explained. Scientific American,
https://blogs.scientificamerican.com/observations/the-pause-in-global-warming-is-finally-explained/.
Gratz, J., 2016, How El Nino, La
Nina, and the Pacific Decadal Oscillation influence snowfall in the United
States. Unfortunately, it's complicated. Openshow,
https://opensnow.com/news/post/how-el-nino-la-nina-and-the-pacific-decadal-oscillation-influence-snowfall-in-the-united-states-unfortunately-it-s-complicated.
Gorvett, Z., 2017, The massive
volcano that scientists can’t find. BBC, http://www.bbc.com/future/story/20170630-the-massive-volcano-that-scientists-cant-find.
Heinrich,
H.,1988, Origin and consequences of cyclic ice rafting in the northeast
Atlantic Ocean during the past 130 000 years. Quat. Res., 29, 143–152.
Highfield, R., Uhlig, R., and
Derbyshire, D., 2000, Comet caused Dark Ages, says tree ring expert. The
Telegraph https://www.telegraph.co.uk/news/uknews/1354622/Comet-caused-Dark-Ages-says-tree-ring-expert.html.
Hughes, L., and Herian, A., 2017,
The correlation between GDP and greenhouse gas emissions. Policy Options
Politiques, http://policyoptions.irpp.org/magazines/september-2017/the-correlation-between-gdp-and-greenhouse-gas-emissions/.
International Energy Agency (IEA),
2016. CO2 Emissions from Fuel Combustion. IEA, https://www.iea.org/statistics/co2emissions/.
Klotzbach, P.J., 2011, The Influence
of El Niño–Southern Oscillation and the Atlantic Multidecadal Oscillation on
Caribbean Tropical Cyclone Activity. America Meteorological Society,
https://journals.ametsoc.org/doi/10.1175/2010JCLI3705.1. https://doi.org/10.1175/2010JCLI3705.1.
Krazytrs, 2017, In search of the
colossal volcano that reached Europe in Century XV. Ultimate Science, http://www.ultimatescience.org/search-colossal-volcano-reached-europe-century-xv/.
Lyatsky, H., 2017. The air war for
oil: why we lose and how to win; The Source (Canadian Association of
Geophysical Contractors), v. 13/4, p. 31-32.
McGarvey, D., 2016, Alberta nosedives
on global oil and gas investment ranking. Canadian Broadcasting Corporation
(CBC), https://www.cbc.ca/news/canada/calgary/alberta-oil-gas-fraser-institute-survey-1.3883687.
McManus,
J., R., Gherardi, F. J.-M., Keigwin, L., and Brown-Leger, S., 2004, Collapse
and rapid resumption of Atlantic meridional circulation linked to deglacial
climate changes. Nature, 428, 834–837.
Natural
Resources of Canada (NRC), 2018a, Electricity facts. https://www.nrcan.gc.ca/energy/facts/electricity/20068.
Natural
Resources of Canada (NRC), 2018b, Energy and Greenhouse Gas Emissions (GHGs), https://www.nrcan.gc.ca/energy/facts/energy-ghgs/20063.
NOAA National Centers for
Environmental information, 2014,.
http://www.pmel.noaa.gov/tao/proj_over/diagrams/index.html
NOAA National Centers for
Environmental information, 2018, Climate at a Glance: Statewide Mapping, from https://www.ncdc.noaa.gov/cag/.
North
Carolina State University (NCSU), 2018, Global Patterns: Pacific Decadal
Oscillation. https://climate.ncsu.edu/climate/patterns/pdo.
Pidwirny,
M. (2006),Surface and Subsurface Ocean Currents: Ocean Current Map.
Fundamentals of Physical Geography, 2nd Edition. Date Viewed. http://www.physicalgeography.net/fundamentals/8q_1.html
Radford, T., 2015, Growing threat to Amazon’s
crucial carbon sink. Climate news network,
https://climatenewsnetwork.net/growing-threat-to-amazons-crucial-carbon-sink/.
Rahmstorf, S., 2003,
The concept of the thermohaline circulation . Nature. 421 (6924): 699. Bibcode:2003Natur.421..699R. doi:10.1038/421699a. PMID 12610602.
Scheer, R., and Moss, D., 2012,
Deforestation and Its Extreme Effect on Global Warming. Scientific America, https://www.scientificamerican.com/article/deforestation-and-global-warming/.
Schwartz, J.D., 2014, Soil as Carbon
Storehouse: New Weapon in Climate Fight? YaleEnvironment360,
https://e360.yale.edu/features/soil_as_carbon_storehouse_new_weapon_in_climate_fight.
Schultz, N., 2009, Natural mechanism
for medieval warming discovered. Newscientist, https://www.newscientist.com/article/dn16892-natural-mechanism-for-medieval-warming-discovered/.
Shindell, T., Schmidt, A., Mann, E.,
Rind, D., Waple, A., Dec 2001, Solar Forcing of Regional Climate Change During
the Maunder Minimum. Science. 294 (5549): 2149–2152.
Bibcode:2001Sci...294.2149S. doi:10.1126/science.1064363. ISSN 0036-8075. PMID
11739952.
Smith, R. S., Dubois, C., Marotzke,
J., 2005, Global Climate and Ocean Circulation on an Aqua planet
Ocean–Atmosphere General Circulation Model. American Meteorological Society,
Journal Climate Volume 19, https://pure.mpg.de/rest/items/item_994530/component/file_994529/content.
Spufford, F. Red Plenty; Faber and Faber.
Trenberth, K. E.;
Hoar, T. J., 1996, The 1990–1995 El Niño–Southern Oscillation event: Longest on
record.. Geophysical Research Letters. 23 (1): 57–60. Bibcode:1996GeoRL..23...57T. doi:10.1029/95GL03602.
US Energy Information Administration (EIA), 2018, What is U.S.
electricity generation by energy source?
https://www.eia.gov/tools/faqs/faq.php?id=427&t=3
University Corporation for
Atmospheric Research (UCAR), 2018a, Ocean on the Move: Thermohaline
Circulation. https://scied.ucar.edu/ocean-move-thermohaline-circulation.
University Corporation for
Atmospheric Research (UCAR), 2018b, Melting Arctic Sea Ice and Ocean
Circulation. https://scied.ucar.edu/longcontent/melting-arctic-sea-ice-and-ocean-circulation.
University Corporation for
Atmospheric Research (UCAR), 2018c, Atlantic Multi-decadal Oscillation (AMO).
https://climatedataguide.ucar.edu/climate-data/atlantic-multi-decadal-oscillation-amo.
Upton, J., 2016, How a Volcano Hid
the Acceleration of Sea Level Rise. Climate Central, http://www.climatecentral.org/news/volcano-hid-sea-level-rise-acceleration-20595.
Ward, M.A., 2015, The Principal
Greenhouse Gases and Their Sources. NEEF https://www.neefusa.org/weather-and-climate/climate-change/principal-greenhouse-gases-and-their-sources.
Weber, B., 2018, Study suggests global
GHG emissions would drop if world’s oil producers followed Canadian industry
rules. The Canadian Press, https://globalnews.ca/news/4427014/oil-industry-greenhouse-gas-emissions-canada-science/.
Wittenberg, A.T.,
2009, Are historical records sufficient to constrain ENSO simulations?. Geophys. Res.
Lett. 36 (12): L12702. Bibcode:2009GeoRL..3612702W. doi:10.1029/2009GL038710.
Wikipedia, 2018a, Atmospheric
circulation. https://en.wikipedia.org/wiki/Atmospheric_circulation.
Wikipedia, 2018c, Gulf Stream.
https://en.wikipedia.org/wiki/Gulf_Stream.
Woods Hole Oceanographic Institute
(WHOI), 2018, El Niño & Other Oscillations.
http://www.whoi.edu/main/topic/el-nino-other-oscillations.
Yochanan, K., 2000.
The Climate System: General Circulation and Climate Zones. https://eesc.columbia.edu/courses/ees/climate/lectures/gen_circ/index.html


Comments
Post a Comment